

How to Find the Big Picture in a Long Report
Long reports create a specific kind of reading problem. You may understand each paragraph, table, and chart, yet still finish with a vague feeling that you missed the main point. The details are there, but the big picture is buried under background, methodology, evidence, caveats, and recommendations.
Finding the big picture in a long report is not the same as skimming for a short summary. A summary tells you what the report contains. The big picture tells you what the report is really saying, why it matters, and what should happen next.
This guide gives you a practical workflow for reading long reports with less friction. You can use it for business reports, policy briefs, research reports, technical documentation, annual reports, market analysis, internal memos, or any long document where the main idea is hard to see.
What the big picture actually means
When someone asks for the big picture, they are usually not asking for every key point. They want the central meaning of the report.
A useful big-picture view answers six questions:
- What question or problem is the report trying to address?
- What is the main answer, conclusion, or argument?
- What evidence supports that answer?
- Why does the answer matter now?
- What limitations, risks, or uncertainties affect the conclusion?
- What should the reader think, decide, or do next?
If you cannot answer those questions in a few plain sentences, you may have collected information but not yet understood the report.
This is why long reports often feel frustrating. They are not only long. They are layered. The author may move from context to data, from data to interpretation, from interpretation to recommendations, and from recommendations back to caveats. Your job is to reconstruct that logic.
Start with the report's job, not page one
Before reading closely, identify what kind of work the report is doing. A report written to support a policy decision should be read differently from a technical postmortem or a quarterly business review.
Ask a few orientation questions before you commit to a full read:
- Who created the report?
- Who is the intended audience?
- What decision, debate, or problem does it appear to serve?
- What section titles repeat or stand out?
- Where are the conclusions, recommendations, or implications located?
These questions prevent you from treating every detail as equally important. They also help you decide whether you need a quick orientation, a careful reading, or a deep analysis. If you are unsure how much attention a document deserves, unrav's guide to choosing the right reading mode can help you separate quick grasping from deeper reading.
| Report type | Usually tries to answer | Where to look first |
|---|---|---|
| Research report | What did we investigate, and what did we find? | Abstract, introduction, methods, findings, discussion |
| Business report | What is happening, why, and what should we do? | Executive summary, key metrics, recommendations |
| Policy brief | What problem needs action, and which option is best? | Problem statement, options, tradeoffs, recommendation |
| Technical report | How does something work, fail, or improve? | Scope, system description, analysis, limitations |
| Market report | What trends or shifts matter for a sector? | Overview, trend sections, forecast assumptions |
This first step is not about understanding everything. It is about building a frame so that the rest of the report has somewhere to fit.
Use a three-pass method instead of reading straight through
Most readers try to solve long reports with endurance. They begin on page one, read line by line, highlight heavily, and hope the main idea becomes clear by the end. That can work, but it is slow and often leaves you with disconnected notes.
A better method is to read in three passes.
Pass 1: Orientation
Spend 10-15 minutes scanning the report before reading deeply. Look at the title, subtitle, table of contents, executive summary, section headings, figures, tables, conclusion, and recommendations.
Then write a rough guess in one sentence:
This report is probably about [problem], and it seems to argue that [main point].
This guess does not need to be correct. It gives your brain a hypothesis to test while reading.
Pass 2: Structure
Now read for the report's architecture. Instead of asking what each page says, ask what role each section plays.
A long report usually contains a sequence like this:
- Context: why the topic matters
- Problem: what issue or gap needs attention
- Method or approach: how the authors investigated it
- Evidence: what data, cases, or examples they use
- Findings: what the evidence suggests
- Interpretation: what the findings mean
- Recommendation: what should happen next
- Caveats: what the authors are unsure about
Not every report uses these labels, but most serious reports contain some version of this chain. Mark the sections by function, not just by topic.
Pass 3: Synthesis
After you understand the structure, read again only where needed. Your goal is to answer the big-picture questions with confidence.
At this point, stop collecting more details unless they change the overall meaning. A useful synthesis might sound like this:
This report argues that [main conclusion] because [strongest reason]. This matters because [stake or consequence]. The recommended next step is [action], but the conclusion depends on [important caveat].
That sentence is the beginning of real understanding.
Follow the central thread across sections
Long reports often feel scattered because the main idea is split across many places. The problem may appear near the beginning, the strongest evidence may appear in the middle, and the actual recommendation may sit near the end.
To find the central thread, look for connections rather than isolated facts.
For example, imagine a 60-page report on customer churn. A weak big-picture note might say:
Customer churn increased in Q2. The report discusses onboarding, support tickets, pricing, and competitor activity.
That is a topic list. It does not explain the report's meaning.
A stronger big-picture version would say:
Churn increased mainly among new enterprise customers because onboarding delays created early frustration. Pricing and competitors played a smaller role. The report recommends reducing implementation time before changing the pricing model.
The difference is the chain of reasoning. The stronger version identifies cause, relative importance, and action.
As you read, keep asking:
- What does this section explain?
- What earlier point does it support or challenge?
- Is this detail central, secondary, or only background?
- Does this evidence lead to a specific conclusion?
If a section does not change the main answer, it may not belong in your big-picture summary.
Separate evidence from interpretation
One reason readers lose the big picture is that reports mix facts, analysis, assumptions, and recommendations. You need to know which is which.
| What you see in the report | What it usually is | Question to ask |
|---|---|---|
| Historical context | Background | Why does this matter for the current problem? |
| Metrics, survey results, or observations | Evidence | What claim does this support? |
| A chart or table | Condensed evidence | What pattern is the author highlighting? |
| Phrases like this suggests or this indicates | Interpretation | Is the evidence strong enough for this claim? |
| Proposed actions | Recommendation | What conclusion makes this action reasonable? |
| Limitations or assumptions | Caveat | How much should this change my confidence? |
This distinction matters because the big picture is not just the loudest claim. It is the claim that is best supported by the report's evidence and reasoning.
For students, this helps when turning readings into exam notes. For researchers, it helps separate a paper's actual contribution from its literature review. For professionals, it helps avoid presenting a recommendation without understanding the assumptions behind it.
Build a one-page big-picture note
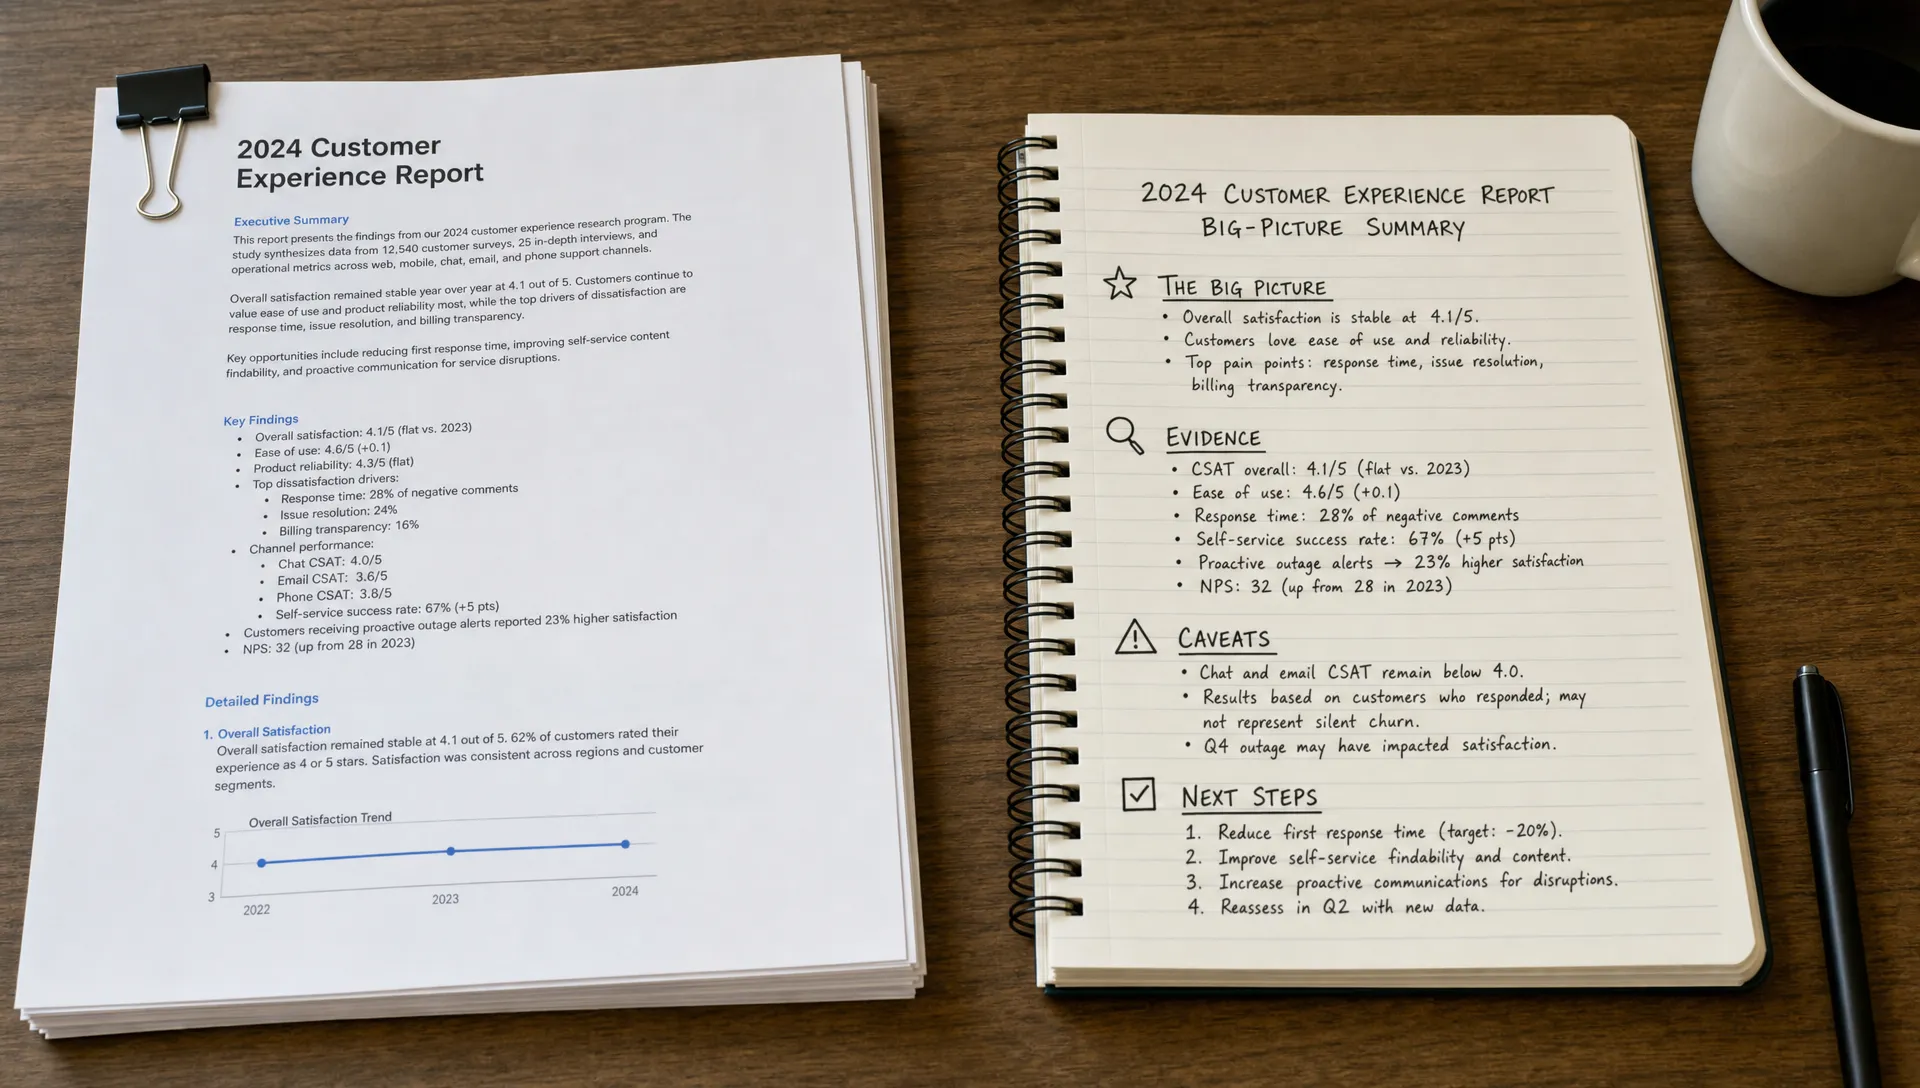
After reading, create one page that captures the report's meaning. Keep it short enough that you can review it quickly later.
A practical one-page note has five parts:
- Main answer: the report's central conclusion in one sentence
- Why it matters: the decision, risk, opportunity, or question behind the report
- Evidence: three to five points that most strongly support the conclusion
- Caveats: the limits, uncertainties, missing data, or competing explanations
- Next step: what the report implies for action, discussion, or further research
This format forces you to synthesize. It also makes your notes more useful for meetings, essays, literature reviews, presentations, or content repurposing.
If you need to share your understanding with others, the next challenge is communication. The guide on summarizing findings so people actually understand explains how to turn analysis into a clear message for a specific audience.
Map the relationships when the report is complex
Sometimes a paragraph summary is not enough. This is especially true when a report contains many actors, causes, tradeoffs, or dependencies.
In those cases, create a simple relationship map. Put the central problem in the middle, then connect it to causes, evidence, consequences, recommendations, and uncertainties.
For example, a policy report might connect housing costs to zoning rules, construction delays, income growth, migration patterns, and financing conditions. A linear summary can flatten those relationships. A map lets you see which factors drive the overall argument.
You do not need a complicated diagram. A useful map might contain only five elements:
- Problem
- Main causes
- Key evidence
- Implications
- Recommended action
This is especially helpful for researchers comparing several studies, students preparing for exams, and educators turning dense material into teachable lessons. If you want a more visual workflow, this guide on how to turn dense reading into clear diagrams shows how idea maps can reveal relationships that linear notes often hide.
Use AI as a reading partner, not a shortcut
AI can help you find the big picture faster, but it should not replace your judgment. The risk with any summary tool is that it can make a report feel understood before you have checked the reasoning.
A better approach is to use AI for reframing and testing. With unrav.io, you can work from links, text, PDFs, videos, and other content, then reframe the material through different thinking modes such as quick grasp or teach-it. The value is not only shorter text. It is seeing the same material from different angles so you can understand it more clearly.
Try prompts or tasks like these when working with a long report:
- Identify the central question this report is trying to answer.
- Explain the report's main argument in plain English.
- Separate the evidence, interpretation, recommendations, and caveats.
- Show the problem, causes, evidence, and implications as a simple structure.
- List the assumptions that the conclusion depends on.
- Explain what a beginner might misunderstand about this report.
Then compare the AI output with your own reading. If it misses a caveat, overstates a claim, or ignores an important section, revise your understanding. This is how AI becomes a comprehension aid rather than a substitute for reading.
Adapt the method to your purpose
The big picture is not identical for every reader. The same report can support different tasks.
A student may need to understand the argument well enough to discuss it in class. A researcher may need to extract the method, contribution, and limitations. A manager may need to decide whether the recommendation is strong enough to act on. A creator may need to turn the report into a newsletter, script, or explainer. An educator may need to simplify the material without distorting it.
| Reader | Best big-picture output |
|---|---|
| Student | A study note with the main argument, key evidence, and likely exam questions |
| Researcher | A structured note covering research question, method, findings, contribution, and limitations |
| Professional | A decision brief with what changed, why it matters, and what action is recommended |
| Content creator | An outline that turns the report into themes, examples, and audience-friendly takeaways |
| Educator | A teaching explanation that preserves accuracy while reducing unnecessary complexity |
Before summarizing, decide what you need the big picture for. Your purpose determines which details matter.
Common mistakes that hide the big picture
Mistaking the topic for the thesis
A topic is what the report is about. A thesis is what the report says about that topic. Climate risk, customer churn, labor shortages, and AI adoption are topics. The big picture requires the report's position, finding, or conclusion about them.
Trusting the executive summary too much
Executive summaries are useful, but they are often compressed for busy readers. They may omit uncertainty, nuance, or methodological limits. Read them first for orientation, then verify them against the evidence and conclusion.
Highlighting before understanding structure
If you highlight too early, you may mark interesting details that later turn out to be secondary. First identify the report's structure. Then highlight evidence that supports or challenges the central argument.
Ignoring caveats
Caveats are not minor details. They tell you how confident you should be. A report with strong findings but narrow data may imply a different action than a report with broad, repeated evidence.
Treating every chart as equally important
Charts are not all central. Some provide background, some support a minor point, and some carry the report's strongest evidence. Always ask what claim the chart is meant to support.
A quick checklist for finding the big picture
Use this checklist after reading a long report:
- I can state the report's main question in one sentence.
- I can explain the central conclusion without copying the report's wording.
- I know which evidence matters most.
- I can separate background details from core findings.
- I understand the main caveats or uncertainties.
- I can explain why the report matters to its intended audience.
- I know what action, decision, or next question follows from the report.
If you cannot check most of these boxes, you probably need another synthesis pass, not more highlighting.
Frequently Asked Questions
What is the fastest way to find the big picture in a long report? Start with the executive summary, table of contents, headings, conclusion, charts, and recommendations. Then write a one-sentence guess about the report's main point and test it as you read.
Should I read the executive summary first or last? Read it first for orientation, but do not stop there. After reading the evidence and conclusion, return to the executive summary and check whether it accurately reflects the report's reasoning and caveats.
How do I find the big picture in a technical report? Focus on the problem, scope, system or method, key findings, limitations, and recommended action. Technical details matter, but they should connect back to what the report explains or recommends.
Can AI find the big picture for me? AI can help surface the main argument, structure the evidence, and reframe dense sections. You should still verify important claims, especially for academic, technical, legal, medical, or business-critical material.
What if a report has no clear main point? Some reports are poorly organized or mainly descriptive. In that case, define the most useful synthesis yourself: what changed, what patterns appear, what questions remain, and what a reader should take away.
Make your next long report easier to understand
Finding the big picture is a repeatable skill. Start by identifying the report's job, read in passes, trace the central thread, separate evidence from interpretation, and finish with a one-page synthesis.
If you want help moving from dense content to clearer understanding, try unrav.io on your next report, PDF, article, or video. Use it to get oriented, reframe difficult sections, and test your own understanding before turning the material into notes, decisions, lessons, or content.