Turn Dense Reading Into Clear Diagrams With an Idea Map Maker
Some reading feels dense because the writer uses hard language. More often, it feels dense because the relationships are hidden. A report may introduce a problem on page two, explain the cause on page seven, show evidence on page twelve, and mention the real limitation in a footnote.
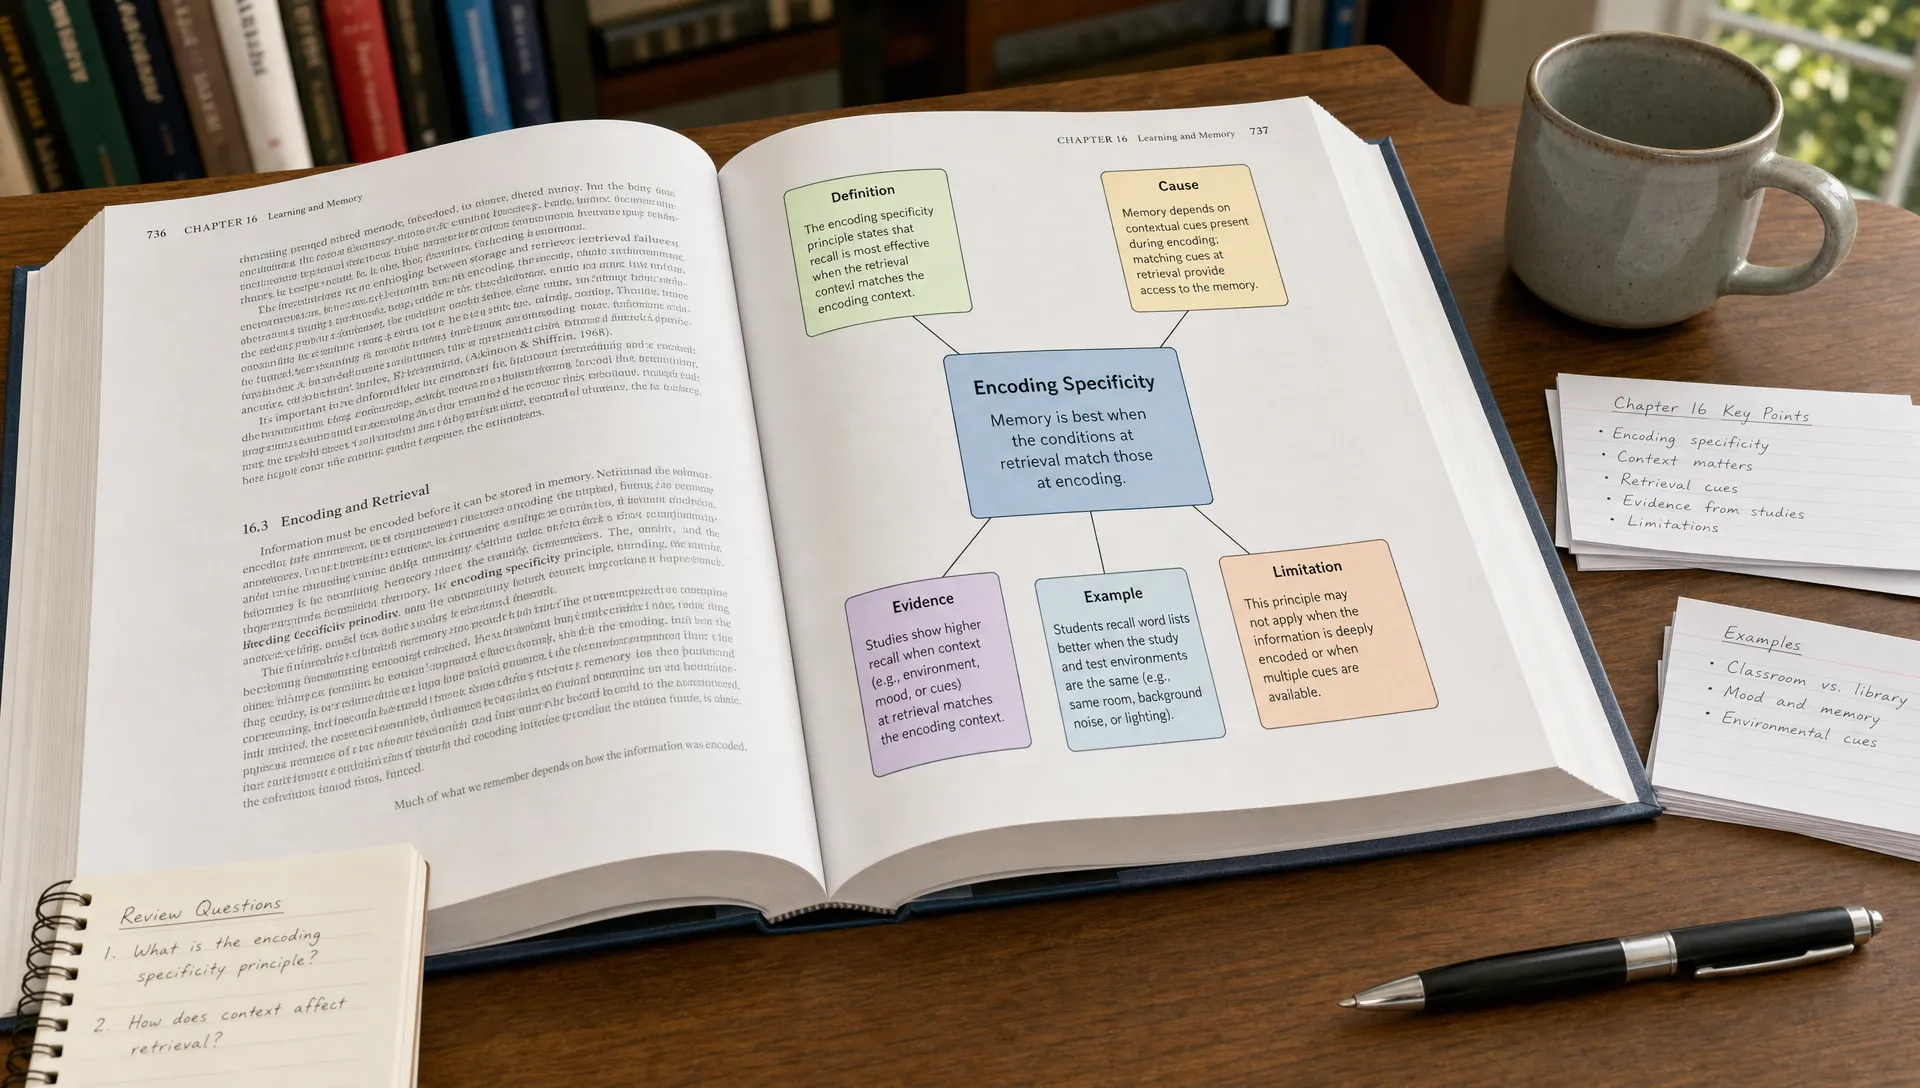
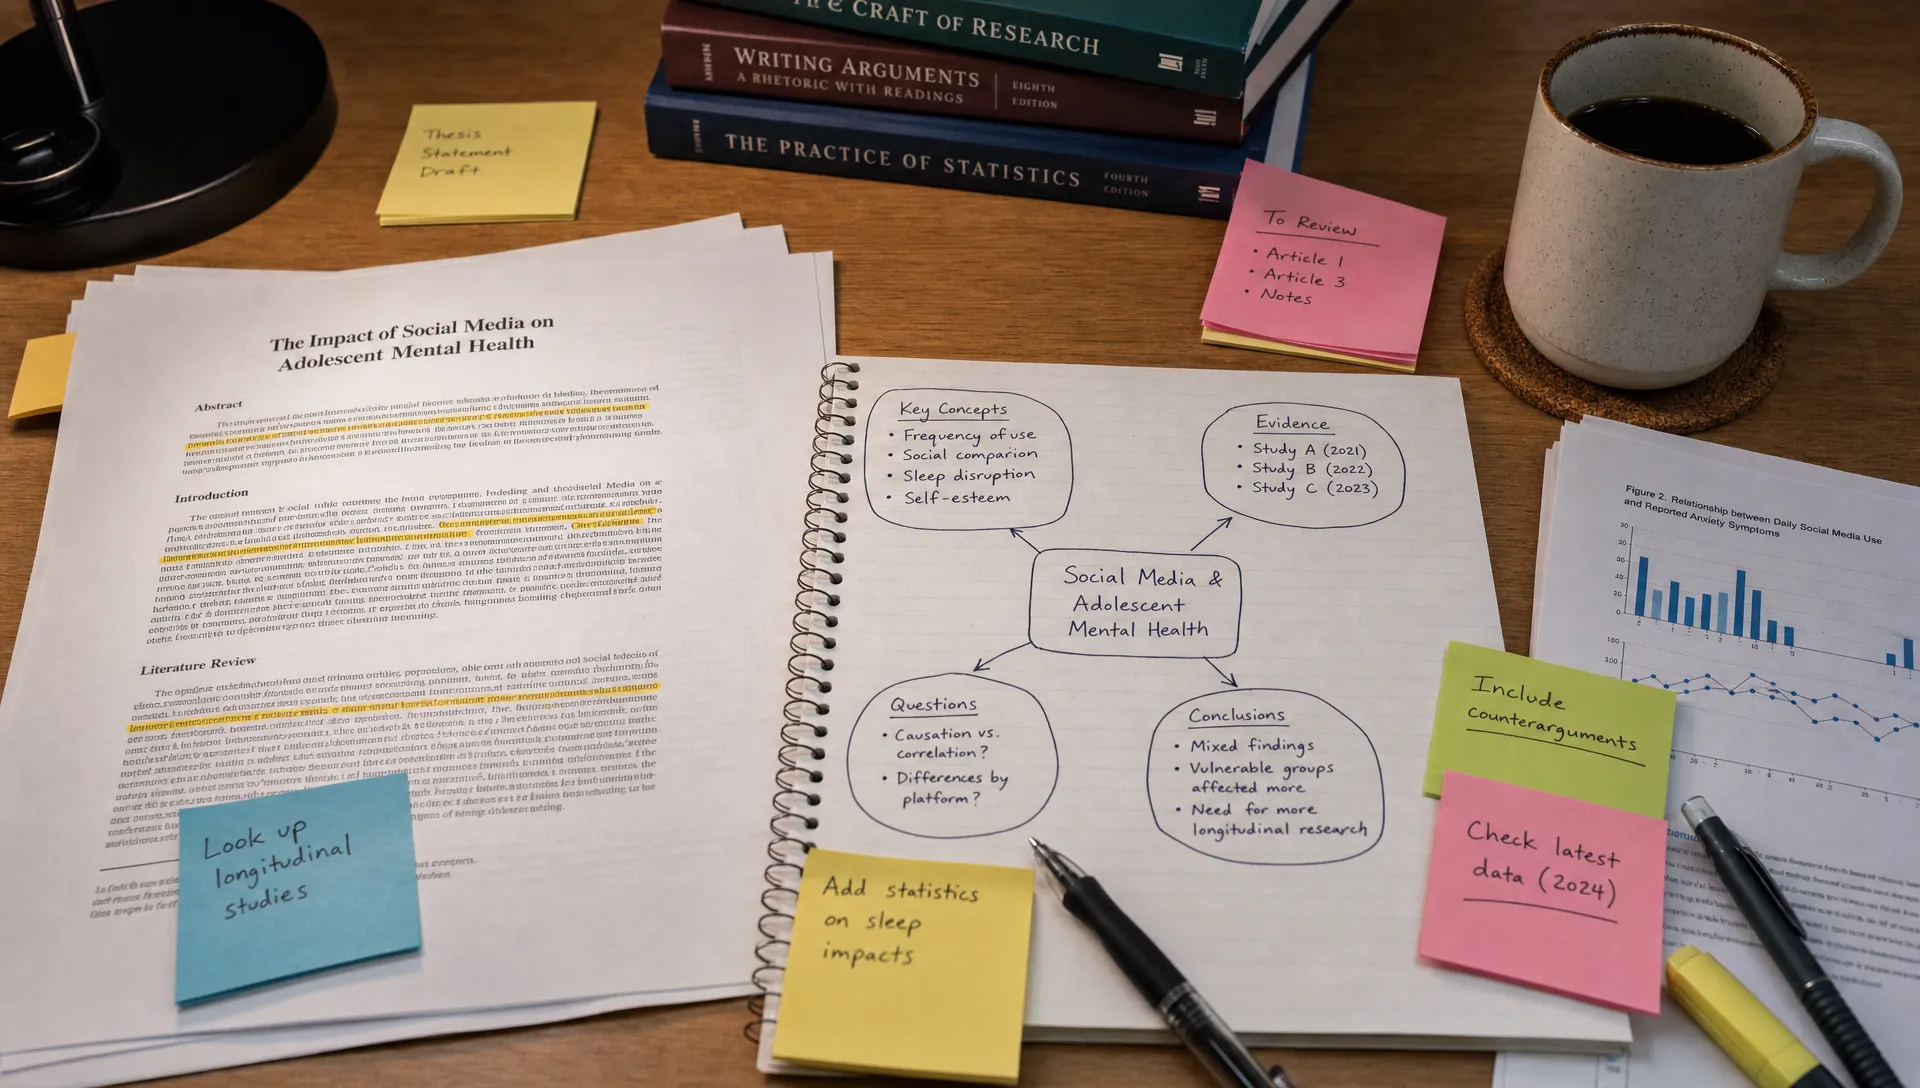
An idea map maker helps you turn that scattered structure into a clear diagram. Instead of copying paragraphs into linear notes, you pull out the main ideas, connect them, and see how the source actually works. This is useful for studying, research, professional reading, teaching, and content planning.
The goal is not to replace careful reading. A good idea map helps you read with more direction, remember more of what matters, and spot gaps in your understanding faster.
Why dense reading becomes clearer as a diagram
Dense material often overloads attention. You are trying to understand definitions, arguments, evidence, examples, caveats, and conclusions at the same time. In a long article, PDF, paper, or transcript, those pieces rarely appear in the order your brain needs them.
A diagram changes the task. Instead of asking, what did this paragraph say, you ask, what role does this idea play?
That shift matters. You stop treating every sentence as equally important and start separating the structure from the surface. A main claim is different from a supporting example. A method is different from a finding. A limitation is different from an implication.
Visual learning research often points to the value of combining verbal and visual information. The Learning Scientists describe dual coding as a way to support learning by pairing words with meaningful visuals. An idea map works best when it is not decoration, but a visual explanation of relationships.
For example, after reading a long policy report, a linear note might say:
The report discusses housing affordability, zoning restrictions, construction costs, migration, wages, and local political resistance.
An idea map can show a clearer structure:
Housing affordability
-> Supply constraints: zoning, permitting, construction costs
-> Demand pressure: migration, income growth, investor activity
-> Policy responses: reform, subsidies, public housing
-> Tradeoffs: speed, equity, political feasibility
The map does not include every detail. That is the point. It gives you a usable mental model before you return to the source for nuance.
What an idea map maker actually does
An idea map maker is a tool or workflow for turning content into connected nodes. Each node represents an idea, and each connection explains how ideas relate.
It can be simple, like a hand-drawn diagram in a notebook. It can also be AI-assisted, where you paste text, add a link, upload a PDF, or use a transcript, then ask the tool to extract and organize the important ideas.
An idea map sits between several familiar formats:
| Format | Best for | Limitation |
|---|---|---|
| Outline | Preserving order and hierarchy | Can hide cross-connections |
| Mind map | Brainstorming around a central topic | Can become vague if relationships are not labeled |
| Concept map | Showing precise relationships between concepts | Can feel too formal for quick reading workflows |
| Idea map | Turning reading into a flexible diagram of claims, evidence, examples, and questions | Needs judgment to avoid mapping too much |
If your goal is a more formal concept relationship diagram, you may also find these concept map maker tips for complex topics and dense reading useful. For everyday reading, though, an idea map is often more flexible. It can include claims, examples, definitions, questions, objections, and next steps in the same visual space.
A practical workflow for turning reading into a clear idea map
The best idea maps are built from a clear purpose. Before you start mapping, decide what you need from the reading.
A student preparing for an exam might need definitions, causes, comparisons, and likely testable points. A researcher reading a paper may need the research question, method, dataset, findings, limitations, and relation to prior work. A founder or analyst reading an industry report may need trends, risks, opportunities, and assumptions.
Once you know the purpose, follow a simple workflow.
Start with the reading goal
Do not begin by asking, what is everything in this source? That produces clutter.
Ask a sharper question instead:
- What decision, assignment, project, or conversation is this reading for?
- What do I need to remember after closing the document?
- What relationships are most important, causes, contrasts, evidence, steps, or tradeoffs?
- What would I need to explain this clearly to someone else?
This goal becomes the center of the map. For a research paper, the center might be the main research question. For a business report, it might be the key market shift. For a lecture video, it might be the core concept being taught.
Extract only the strongest nodes
Dense reading tempts you to map everything. Resist that. A useful idea map usually starts with a small set of node types:
- Main claim or thesis
- Key definitions
- Supporting evidence
- Causes or mechanisms
- Examples or case studies
- Limitations or objections
- Implications or applications
If a detail does not help explain the central idea, leave it out for now. You can always add it later.
This is where AI can help, especially when the source is long. With an AI reading companion like unrav.io, you can work from articles, pasted text, PDFs, YouTube videos, or podcasts and use different thinking modes to reframe the material. That can give you a cleaner first pass before you refine the map yourself.
Label the relationships, not just the topics
A weak map says topic A, topic B, topic C. A strong map says topic A causes topic B, topic B conflicts with topic C, and topic C is supported by evidence D.
Relationship labels are what turn a messy cluster into a thinking tool. Use plain verbs and phrases, such as:
- causes
- depends on
- supports
- contradicts
- explains
- leads to
- is an example of
- is limited by
- applies to
For example, if you are mapping a paper about sleep and memory, do not simply connect sleep, memory, and learning. Label the connections: sleep supports memory consolidation, stress disrupts sleep quality, and poor sleep reduces attention during learning.
That extra wording forces comprehension. If you cannot label the relationship, you may not understand it yet.
Choose a diagram shape that fits the source
Different readings need different map structures. An idea map maker is most useful when you choose the shape intentionally.
| Source type | Useful map structure | Best questions to ask |
|---|---|---|
| Research paper | Question, method, findings, limitations, implications | What did they test, how, and what should I trust or question? |
| Textbook chapter | Core concept, subtopics, examples, exceptions | What must I understand before the next topic makes sense? |
| Business report | Trend, drivers, risks, opportunities, recommendations | What changed, why does it matter, and what action follows? |
| Opinion article | Claim, reasons, evidence, assumptions, counterarguments | What is the author arguing, and where is the argument strong or weak? |
| Lecture or video | Main lesson, steps, examples, warnings, takeaways | What would I need to teach this back clearly? |
If your source is a long PDF, it helps to separate extraction from mapping. First identify the ideas that matter, then decide how they connect. This guide on how to read a PDF with AI and pull out the ideas that matter can help if PDFs are a regular part of your workflow.
Example: turning one dense paragraph into an idea map
Imagine you are reading this paragraph:
Remote work can improve employee satisfaction by giving people more control over their schedules, but its effect on productivity depends on role clarity, communication habits, and management practices. Teams with strong documentation and clear decision-making norms often adapt well, while teams that rely on informal office conversations may experience delays, duplicated work, or weaker onboarding.
A rushed summary might say remote work improves satisfaction but has mixed productivity effects. That is accurate, but shallow.
An idea map can show the structure more clearly:
Remote work outcomes
-> Improves: employee satisfaction
-> Depends on: role clarity, communication habits, management practices
-> Works well when: documentation and decision norms are strong
-> Creates risk when: teams rely on informal office conversations
-> Possible problems: delays, duplicated work, weaker onboarding
Now you have something reusable. A student can use it to study workplace theory. A manager can use it to diagnose team problems. A content creator can turn it into a newsletter section or video outline. An educator can use it as a teaching example.
This is the main advantage of idea mapping: it transforms reading from stored text into portable understanding.
How to use an AI idea map maker without losing your own judgment
AI can speed up the first draft of a map, but it should not be treated as the final authority. Dense content often includes nuance, uncertainty, and domain-specific meaning. You still need to check whether the map reflects the source accurately.
A good process is to use AI for extraction, then use your judgment for validation.
Start by asking for a structured map, not a generic summary. A useful prompt might look like this:
Turn this reading into an idea map. Put the central claim in the middle. Add branches for key concepts, evidence, examples, limitations, and implications. Label the relationships between ideas. Keep it concise and flag any points that seem uncertain or need verification.
Then compare the output against the original source. Look especially at claims, numbers, causal statements, and limitations. If the AI turns a correlation into a cause, softens an important caveat, or merges two different ideas, correct the map.
For academic or professional use, this review step is not optional. The map should make your thinking faster, not make you careless.
What different readers can do with an idea map
The same diagram can support different outcomes depending on the reader.
Students can turn assigned readings into study maps. Instead of rereading the same chapter several times, they can map the concepts, then test whether they can explain the connections without looking.
Researchers can use idea maps to compare papers. One paper may use a different method, another may challenge the findings, and another may reveal a limitation. Mapping these relationships helps literature reviews become more analytical and less like a pile of summaries.
Professionals can turn reports into briefings. A clear idea map can separate facts, assumptions, risks, and recommended actions, which is useful before meetings or decision reviews.
Content creators can repurpose long content into outlines. A report can become a newsletter, script, carousel, podcast segment, or teaching resource once the core ideas and relationships are visible.
Educators can use idea maps to simplify complex material for learners. Instead of starting with a long explanation, they can show the structure first, then fill in the details.
If you need a more polished visual format for sharing, unrav.io also offers a way to make content instantly visual from articles, PDFs, and videos. That is helpful when your goal is not only to understand the material, but also to communicate it clearly.
Common mistakes that make idea maps confusing
The first mistake is mapping too much. A diagram with fifty nodes may look impressive, but it often recreates the same overload you were trying to escape. Start small, then expand only where detail helps.
The second mistake is copying the source order. Articles and papers are written in a sequence, but understanding is rarely linear. If the key limitation appears near the end, place it next to the claim it limits.
The third mistake is using vague labels. Words like important, related, and connected do not explain much. Use labels that show the role of the relationship, such as supports, contradicts, causes, depends on, or applies to.
The fourth mistake is ignoring uncertainty. Dense reading often includes assumptions, debates, weak evidence, and open questions. A good idea map should include those, not hide them.
The fifth mistake is treating the map as a finished product. The first version is a thinking draft. The second version is where clarity usually appears.
A simple review checklist before you use the map
Before you study from, share, or act on an idea map, review it quickly.
Ask yourself whether the central idea is specific enough. Check whether every major branch supports the reading goal. Make sure relationship labels are clear. Look for missing evidence, hidden assumptions, and weak connections. Finally, compare the map with the original source to make sure it has not distorted the meaning.
If the map helps you explain the source in your own words, it is probably doing its job.
Frequently Asked Questions
What is an idea map maker? An idea map maker is a tool or workflow that turns information into a diagram of connected ideas. It helps you see claims, evidence, examples, causes, limitations, and implications instead of keeping everything in linear notes.
Is an idea map the same as a mind map? Not exactly. A mind map usually starts with one central topic and branches outward for brainstorming. An idea map is more reading-focused. It shows how ideas inside a source relate, such as what supports a claim, what contradicts it, and what follows from it.
Can I use an idea map maker for research papers? Yes. Idea maps are especially useful for research papers because they can separate the research question, method, findings, limitations, and implications. You should still verify the map against the original paper, especially for technical claims and evidence.
Can AI create an idea map from a PDF or video? AI can create a useful first draft from PDFs, videos, articles, podcasts, and pasted text, depending on the tool. The best results come when you give a clear goal and then review the output for accuracy and missing nuance.
Turn your next dense reading into a clear map
The next time you face a long article, research paper, report, or lecture, do not begin by highlighting everything. Start with one question: what structure am I trying to understand?
Then use an idea map maker to pull out the central claim, supporting ideas, evidence, limitations, and implications. Keep the first version simple. Label the relationships. Revise it until you can explain the reading in your own words.
If you want a faster starting point, try unrav.io with a link, PDF, video, podcast, or pasted text. It can help you reframe complex content into clearer outputs so you can focus less on digging through the material and more on understanding what matters.