How a Semantic Map Maker Reveals Connections in a Topic
If you have ever finished a research paper, report or long video and thought, “I understand the parts, but I cannot see how they fit together,” the problem is usually structure. Linear notes capture information in the order you encountered it. Topics rarely work that way.
A semantic map maker helps by arranging ideas according to meaning. Instead of giving you another summary, it shows clusters, relationships, contrasts and gaps. That makes it useful when you are studying a new subject, reviewing dense material, planning content or trying to explain a complicated idea to someone else.
The goal is not to make a prettier diagram. The goal is to reveal connections that are easy to miss when information is spread across pages, slides, chapters or timestamps.
What is a semantic map?
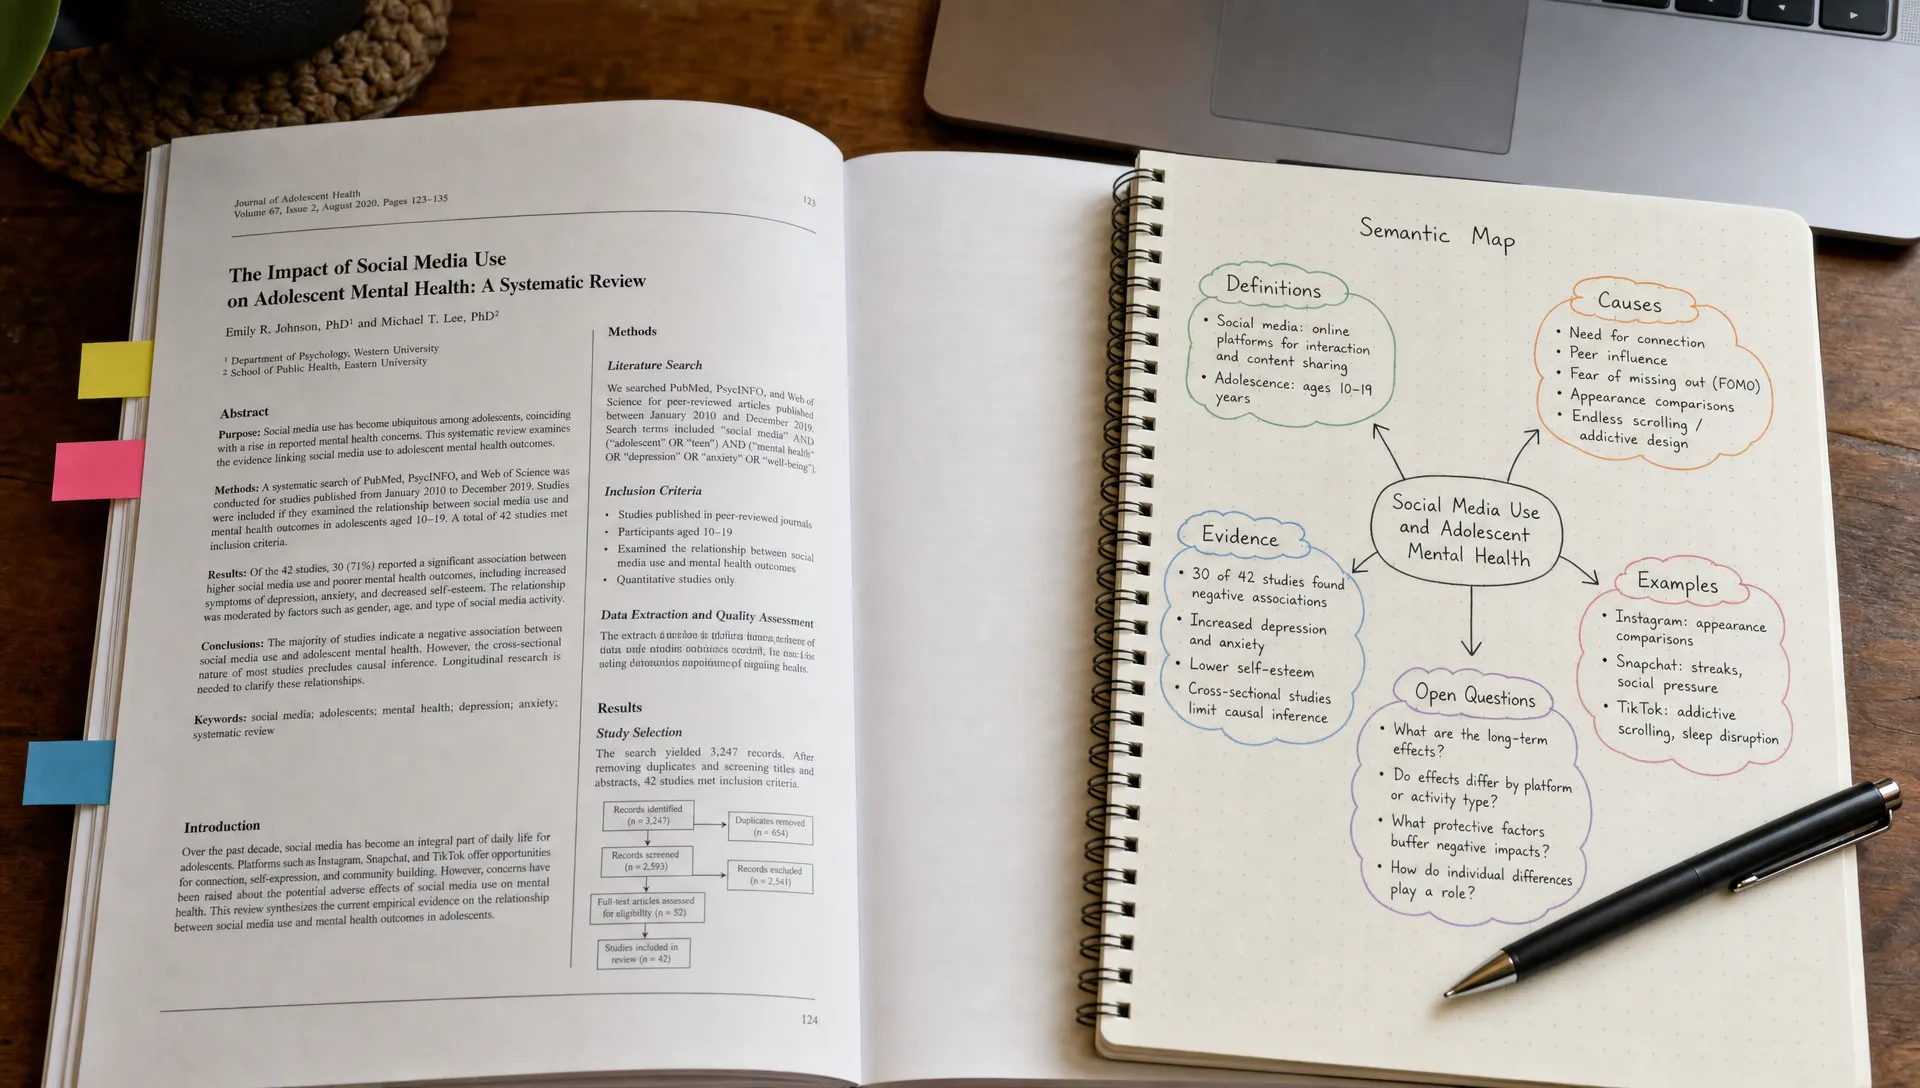
A semantic map is a visual structure that organizes words, concepts and facts by meaning. It often starts with a central topic, then branches into related ideas such as categories, causes, examples, effects, methods, evidence and debates.
For example, if your topic is “renewable energy storage,” a weak set of notes might list lithium batteries, grid stability, hydrogen, cost curves and seasonal demand. A semantic map would show how those ideas relate:
- Lithium batteries support short-duration storage.
- Hydrogen may help with long-duration or seasonal storage.
- Grid stability depends on matching supply and demand.
- Cost curves affect which technologies become practical at scale.
That shift from “items mentioned” to “ideas connected” is the point. A semantic map maker gives your brain a structure for seeing meaning, not just remembering terms.
Why connections disappear in normal notes
Most people take notes in sequence. That works for capturing what was said, but it often hides the logic of the topic.
A dense article may define a term early, give evidence later, introduce an exception near the end and mention a related theory in a footnote. A lecture may jump between examples before explaining the principle that connects them. A YouTube explainer may contain useful ideas, but the structure is buried under storytelling.
This creates four common problems:
- You remember facts but cannot explain the system.
- You can quote a definition but cannot apply it.
- You know several terms but cannot tell which are causes, effects or examples.
- You miss contradictions because related points appeared far apart.
A semantic map solves this by moving from reading order to meaning order. It asks, “What belongs together?” and “What kind of relationship connects these ideas?”
Semantic maps vs mind maps vs concept maps
The terms are often used loosely, but they are not identical. Knowing the difference helps you choose the right format.
| Format | Best for | Typical structure | Main weakness |
|---|---|---|---|
| Semantic map | Revealing meaning relationships inside a topic | Clusters of related terms, examples, causes and effects | Can become vague if relationships are not labeled |
| Mind map | Brainstorming, overview and fast recall | Central idea with branches radiating outward | May show hierarchy without explaining why ideas connect |
| Concept map | Formal understanding of propositions and dependencies | Concepts connected by labeled linking phrases | Can feel slower to build for quick reading tasks |
| Summary | Compressing a source into fewer words | Paragraphs or bullet points | Often hides structure and relationships |
If you want a formal diagram of propositions, a concept map may be better. The guide to using a concept map maker for complex topics is useful when you need that more precise structure.
If you want a fast visual overview of a source, a mind map can be enough. For articles, PDFs and videos, unrav.io’s mind map tool can help turn content into a visual starting point you can inspect, revise and use for learning.
A semantic map sits between those modes. It is more meaning-focused than a simple mind map, but usually less formal than a concept map.
How a semantic map maker reveals connections
A good semantic map maker does more than place words around a topic. It helps you see the hidden structure inside the material.
It groups related ideas by meaning
Dense material often uses several terms for related ideas. In a report about misinformation, you might see “rumors,” “false claims,” “coordinated campaigns,” “bot networks” and “media literacy.” They are connected, but not all in the same way.
A semantic map groups them into meaningful clusters. Some terms describe content, some describe actors, some describe distribution methods and some describe interventions. Once you separate those categories, the topic becomes easier to reason about.
It makes relationship types visible
A line between two ideas is not enough. The useful question is what the line means.
Some relationships show causation: “stress increases cognitive load.” Some show contrast: “qualitative interviews differ from surveys.” Some show evidence: “trial data supports the intervention.” Some show scale: “individual behavior contributes to population-level outcomes.”
When you label those relationships, you stop treating every connection as equal. This is where semantic mapping becomes a thinking tool rather than a decoration.
It exposes gaps in understanding
A map makes missing links visible. You may notice that you have examples but no definition, methods but no findings or claims without evidence.
For students, this is valuable before an exam. For researchers, it helps identify what still needs to be checked in the paper. For professionals, it can reveal that a report’s recommendation is not clearly connected to the data that supposedly supports it.
It helps compare sources
If you are reading several sources on the same topic, a semantic map can become a comparison layer. You can add concepts from each source, then look for overlap and disagreement.
For example, three papers on remote work may all discuss productivity, but one focuses on individual focus time, another on collaboration costs and another on organizational trust. A map lets you see that they are not simply agreeing or disagreeing. They are often studying different parts of the same system.
A practical workflow for building a semantic map
You can create a semantic map manually, with an AI tool or with a mix of both. The process matters more than the tool.
Start with a clear question
Do not begin with “map this topic.” Begin with a question such as “What factors affect student motivation?” or “How does this paper explain supply chain risk?”
A clear question keeps the map focused. Without it, the map can become a collection of anything that sounds relevant.
Extract the key concepts
Read, watch or listen once for the main ideas. Capture terms that seem central, repeated or necessary for explanation. Do not worry about perfect organization yet.
For a research paper, these might include theory, method, variables, findings, limitations and implications. For a business report, they might include market drivers, risks, customer segments, assumptions and recommendations.
Sort concepts into semantic groups
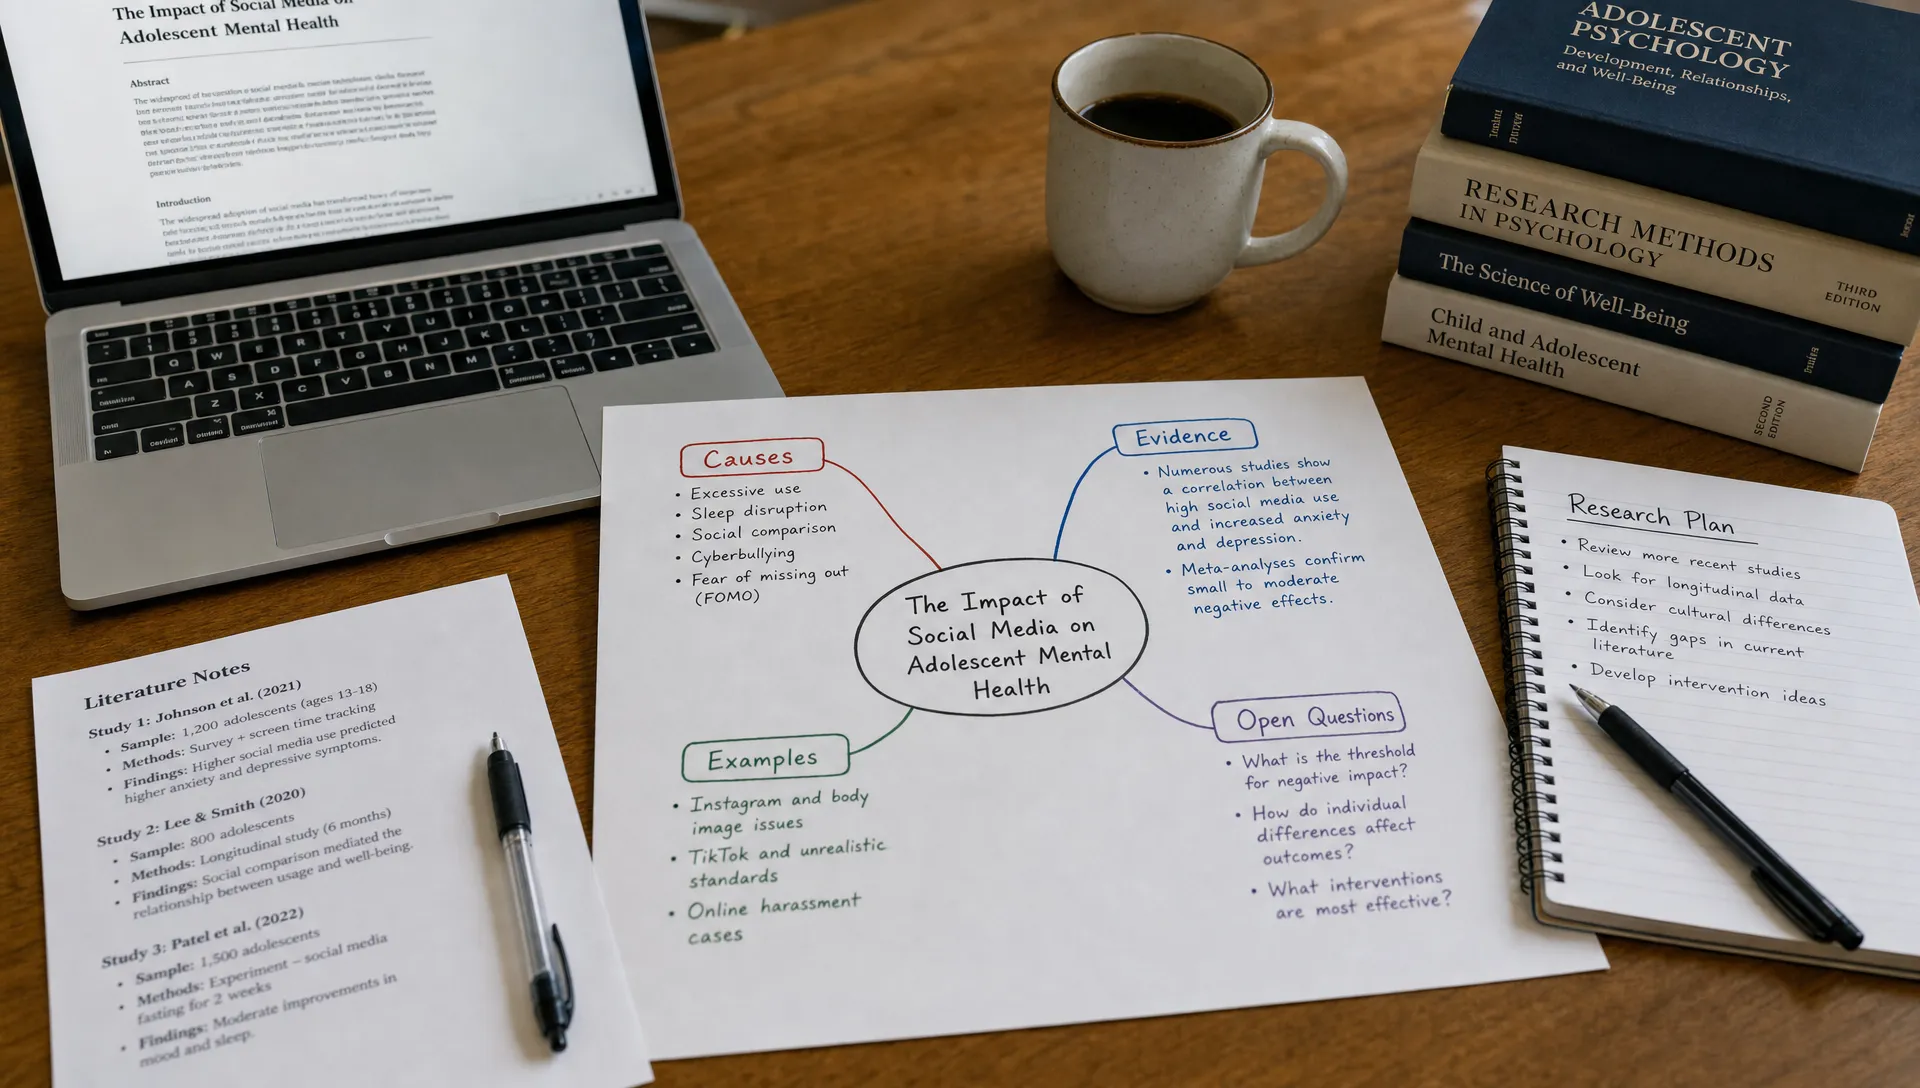
Now group the terms by meaning. Useful group labels include:
- Definitions
- Causes
- Effects
- Examples
- Methods
- Evidence
- Stakeholders
- Tradeoffs
- Open questions
This step is where your understanding begins to improve. You are no longer copying the source. You are interpreting how the pieces function.
Label the connections
Use short verbs or phrases for relationships: causes, supports, contradicts, depends on, is measured by, is an example of, leads to, limits or explains.
Labeled connections are especially helpful when you come back to the map later. An unlabeled line may make sense today, but it often becomes confusing after a week.
Add evidence only where it helps
A semantic map should not contain every detail from the source. Still, key evidence matters. If a claim is central, attach the page number, quote, timestamp or finding that supports it.
This is important for academic work and professional analysis, where you need to trace an idea back to the original source.
Revise after the first version
Your first map is a draft of your understanding. Move nodes, merge duplicates and remove weak connections. If you are using AI to generate an initial map, review it carefully. AI can help you get started faster, but you still need to check whether the relationships are accurate and useful.
Example: mapping a complex topic
Imagine you are trying to understand “urban heat islands.” A summary might say that cities can become hotter than surrounding rural areas because of buildings, pavement, low vegetation and human activity. That is accurate, but it does not show the full structure.
A semantic map could organize the topic like this:
| Semantic group | Example concepts | Connection to the topic |
|---|---|---|
| Physical causes | Asphalt, concrete, building density | Absorb and retain heat |
| Environmental factors | Tree cover, wind flow, surface water | Reduce or intensify local heat |
| Human activity | Traffic, air conditioning exhaust, energy use | Adds waste heat to the environment |
| Health effects | Heat stress, respiratory risk, sleep disruption | Shows why the topic matters |
| Social factors | Income, housing quality, neighborhood investment | Explains unequal exposure and vulnerability |
| Interventions | Cool roofs, shade trees, reflective pavement | Reduces heat or limits harm |
Now the topic is easier to understand. You can see causes, effects, affected groups and possible solutions. You can also ask better questions: Which interventions work fastest? Which are cheapest? Which communities are most exposed? Which evidence supports each claim?
That is the value of a semantic map maker. It turns a topic from a list of facts into a system you can inspect.
How different readers can use semantic maps
Semantic maps are useful because they adapt to the reader’s goal.
Students can use them to prepare for exams. Instead of rereading a chapter several times, they can map definitions, examples and cause-effect relationships. If a branch is thin, that is a signal to revisit that part of the material.
Researchers can use them to unpack papers. A map can separate research questions, theories, methods, findings, limitations and future work. It can also help compare multiple papers without flattening their differences.
Professionals can use them for reports, strategy documents and industry briefings. A semantic map helps show how risks, assumptions, evidence and recommendations connect. This is useful when preparing a brief or explaining a decision to a team.
Creators can use them to repurpose long-form material. A podcast episode, interview or article can become a map of themes, examples and arguments. From there, it is easier to create an outline, newsletter, script or teaching sequence.
Educators can use them to simplify complex material without oversimplifying it. A map can show learners the big picture first, then guide them into details one cluster at a time.
What to look for in a semantic map maker
Not every visual tool helps you think. Some tools make attractive diagrams but leave the hard structure work to you. Others summarize content quickly but do not let you inspect the relationships.
When choosing a tool, look for practical features rather than flashy output:
- It should handle the sources you actually use, such as articles, PDFs, pasted text, videos or podcasts.
- It should preserve enough context that you can trace ideas back to the original material.
- It should let you change the structure instead of treating the first output as final.
- It should support different levels of detail, from quick overview to deeper explanation.
- It should make relationships clearer, not just create a larger version of your notes.
This is where AI can be useful, especially when you are facing a long source and need an initial structure. For example, unrav.io can help reframe content in different modes depending on whether you want a quick grasp, deeper understanding or a teaching-oriented explanation. That makes it useful before you build or refine a map, especially when the source is a PDF, article, YouTube video or podcast.
If your main goal is broader visual thinking rather than semantic detail, this guide on when to use a mind map maker for reading and research may help you choose the better format.
Common mistakes to avoid
A semantic map is only useful if it improves understanding. These mistakes often make maps harder to use.
Adding too many nodes
A map with 80 concepts may look thorough, but it can become unreadable. Start with the most important 10 to 20 ideas. Add more only when the structure is clear.
Using vague labels
Labels like “related to” or “connected with” do not explain much. Stronger labels include “causes,” “depends on,” “is measured by,” “supports,” “contradicts” and “is an example of.”
Mapping before you understand the source
It is fine to generate a first draft early, but do not trust it immediately. Read enough of the source to know whether the map reflects the author’s actual argument.
Treating the map as the final output
A map is a thinking aid. You may still need a summary, outline, study guide or written explanation. The map helps you create those outputs with a clearer structure.
How to turn a semantic map into useful work
Once you have a map, use it actively. Do not let it sit as a static diagram.
For studying, cover the map and try to recreate it from memory. Then compare your version with the original. The missing links show what to review.
For research, turn each cluster into a section of your literature notes. Add citations, methods and limitations under the relevant branches.
For professional work, use the map to build a briefing structure. Start with the central issue, then explain causes, evidence, tradeoffs and recommendations.
For content creation, turn clusters into sections of an article, episode outline or lesson plan. The map helps avoid a common problem: jumping between points without showing the reader how they connect.
A semantic map maker is most valuable when it becomes part of a workflow. It helps you move from input to understanding, then from understanding to output.
Frequently Asked Questions
What is a semantic map maker used for? A semantic map maker is used to organize ideas by meaning so you can see categories, relationships, examples, causes, effects and gaps inside a topic. It is useful for studying, research, writing, teaching and analyzing dense material.
How is a semantic map different from a mind map? A mind map usually starts with one central idea and branches outward for brainstorming or overview. A semantic map focuses more on meaning relationships, such as cause-effect, evidence, contrast, examples and categories.
Can AI create a semantic map automatically? AI can create a useful first draft by extracting concepts and suggesting relationships from a source. You should still review the map, correct weak links and verify important claims against the original material.
Is a semantic map better than a summary? It depends on your goal. A summary is better when you need a short version of the source. A semantic map is better when you need to understand how the ideas connect and where the structure of the topic is unclear.
Make complex topics easier to connect
If a topic feels scattered, do not start by rereading everything from the beginning. Start by mapping the meaning. Identify the key ideas, group them, label the relationships and check where your understanding is still thin.
Tools like unrav.io can help you turn articles, PDFs, videos, podcasts or pasted text into clearer starting points for thinking. Use AI to reduce friction, then use your judgment to refine the map until the topic makes sense.